Dimensional Modelling
Dimensional modelling organizes analytics around facts and dimensions. A fact table records measurements at a declared grain, such as one row per order line. Dimension tables describe the context used to slice those facts, such as customer segment, product, or calendar date.
Star schema
A star schema is a dimensional model with one or more central fact tables surrounded by dimension tables. The fact table owns the analytical grain and numeric measures; dimensions own the labels, hierarchies, and slowly changing context used for filters and grouping. Compared with normalized relational-modelling, a star schema makes SQL easier for analysts because common questions become “join the fact to a few descriptive dimensions, then aggregate at the requested level.”
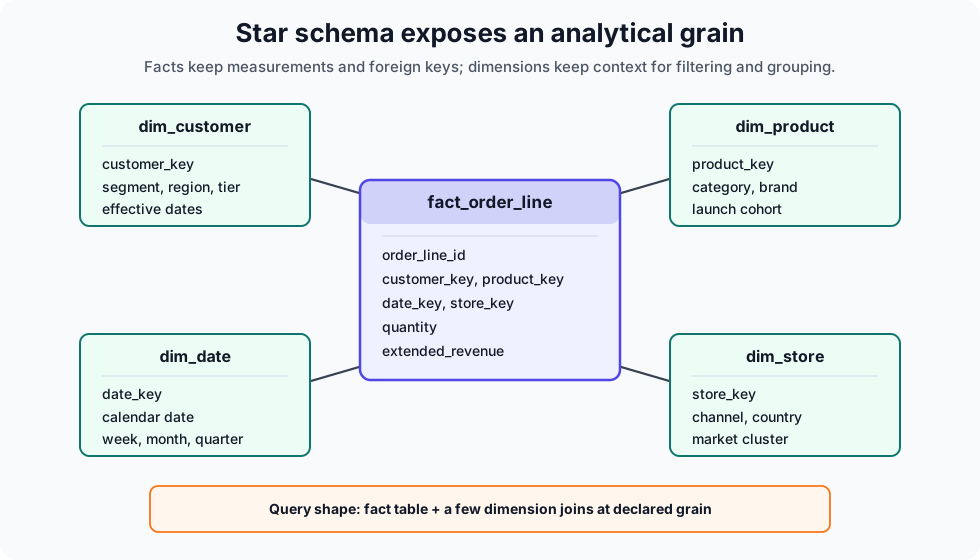
This example follows the same shape as the diagram: a central fact_order_line table joins to customer, product, date, and store dimensions. It also uses a type-2 customer dimension, where customer C-7 changed segment over time and facts keep the historical customer_key.
WITH dim_customer(
  customer_key,
  customer_id,
  segment,
  effective_from,
  effective_to,
  is_current
) AS (
  VALUES
    (1, 'C-7', 'startup', '2026-01-01', '2026-02-01', 0),
    (2, 'C-7', 'enterprise', '2026-02-01', NULL, 1),
    (3, 'C-9', 'consumer', '2026-01-01', NULL, 1)
),
dim_product(product_key, category, brand, launch_cohort) AS (
  VALUES
    (10, 'analytics', 'StarterKit', '2025-Q4'),
    (11, 'platform', 'ScaleBox', '2026-Q1')
),
dim_date(date_key, calendar_date, week, month, quarter) AS (
  VALUES
    (20260120, '2026-01-20', '2026-W04', '2026-01', '2026-Q1'),
    (20260218, '2026-02-18', '2026-W08', '2026-02', '2026-Q1')
),
dim_store(store_key, channel, country, market_cluster) AS (
  VALUES
    (100, 'online', 'DE', 'DACH'),
    (101, 'retail', 'US', 'North America')
),
fact_order_line(
  order_line_id,
  order_id,
  customer_key,
  product_key,
  date_key,
  store_key,
  quantity,
  extended_revenue
) AS (
  VALUES
    (9001, 501, 1, 10, 20260120, 100, 2, 100),
    (9002, 502, 2, 11, 20260218, 100, 3, 300),
    (9003, 503, 3, 10, 20260218, 101, 1, 50)
)
SELECT
  c.segment,
  p.category,
  s.channel,
  sum(f.quantity) AS units,
  sum(f.extended_revenue) AS revenue
FROM fact_order_line f
JOIN dim_customer c USING (customer_key)
JOIN dim_product p USING (product_key)
JOIN dim_date d USING (date_key)
JOIN dim_store s USING (store_key)
WHERE d.quarter = '2026-Q1'
GROUP BY c.segment, p.category, s.channel
ORDER BY revenue DESC;
Result:
segment     category   channel  units  revenue
enterprise  platform   online   3      300
startup     analytics  online   2      100
consumer    analytics  retail   1      50
The January order remains attributed to startup even though the current customer row is enterprise. That is the point of carrying dimension surrogate keys into the fact table. The same fact rows can also be sliced by product category, store channel, or calendar quarter without changing the declared grain: one row per order line.
Warehouse use
Data-warehouses and BigQuery marts often materialize dimensional models because dashboards need stable metric definitions and predictable joins. At large scale, distributed-warehouse-modelling keeps the same star-schema grain while adding partitioning, clustering, and aggregate tables for common query patterns. dbt is commonly used to encode staging, dimension, and fact models as versioned SQL.
Failure modes
If fact grain is vague, revenue can double after joining to a multi-row dimension. If slowly changing dimensions are overwritten in place, historical metrics inherit today’s attributes. If dimensions lack durable business keys, late-arriving facts cannot be matched reliably.
References
- Microsoft Learn: Understand star schema and the importance for Power BI
- PostgreSQL documentation: Table expressions
Nav
Section — Data Engineering