Covariance and Correlation
Covariance measures whether two random variables tend to be above or below their means together:
Correlation standardizes covariance by the two standard deviations:
Covariance keeps the product of the units; correlation is unitless and lies in when variances are positive. Covariance matrices are central in statistical modelling and PCA.
Executed sample check
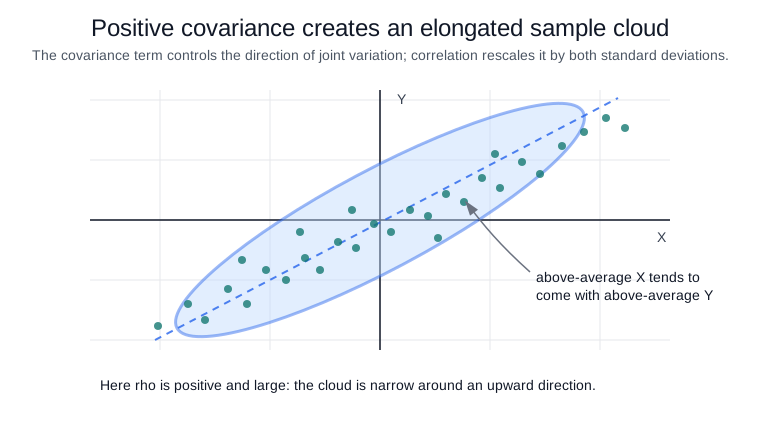
The code below draws 5000 observations from a bivariate normal distribution with mean vector and covariance matrix
The diagonal entries say that and . The off-diagonal covariance is , so the population correlation should be
This snippet draws a bivariate normal sample with known covariance and compares the sample covariance and correlation with the theoretical correlation.
import numpy as np

rng = np.random.default_rng(20260711)
xy = rng.multivariate_normal([0, 0], [[4, 1.8], [1.8, 1]], size=5000)
print("sample_cov")
print(np.round(np.cov(xy, rowvar=False), 3))
print("sample_corr", round(np.corrcoef(xy, rowvar=False)[0, 1], 3),
      "theoretical_corr", round(1.8 / (2 * 1), 3))
Observed output:
sample_cov
[[3.891 1.751]
 [1.751 0.979]]
sample_corr 0.897 theoretical_corr 0.9
np.cov(xy, rowvar=False) treats the two columns as the variables and estimates the covariance matrix from the drawn sample. The sample covariance matrix is close to : its variances, 3.891 and 0.979, are near the generating values 4 and 1, while its off-diagonal entry 1.751 is near the generating covariance 1.8.
np.corrcoef(xy, rowvar=False)[0, 1] standardizes that cross-covariance by the sample standard deviations. The sample correlation 0.897 is near the theoretical 0.9; it is not exactly equal because 5000 draws still contain sampling noise.
Caveats
Correlation measures linear association, not causality. Nonlinear dependence can have near-zero correlation, and outliers or shared trends can dominate the estimate.
References
Nav